


TAF Based Regimen Superior to TDF-based Regimen in Efficacy and Renal and Bone Safety for Initial HIV-1 Treatment

Introduction
Elvitegravir/cobicistat/emtricitabine/ tenofovir alafenamide (E/C/F/TAF) has become a recommended initial regimen in the HIV treatment guidelines for the United States (U.S.) and Europe. However, the durability of virologic response and the persistence of the favourable effects of TAF compared with tenofovir disoproxil fumarate (TDF) on renal and bone safety parameters are of long-term interest because HIV-infected patients who initiate TAF containing regimens could anticipate receiving lifelong therapy.
Aim
To assess the 144-week efficacy and safety of tenofovir alafenamide (TAF) vs tenofovir disoproxil fumarate (TDF), each co-formulated with elvitegravir, cobicistat, and emtricitabine (E/C/F) for initial HIV-1 treatment.
Patients Profile
- N= 1733
- Antiretroviral treatment–naive adults
|
% unless otherwise indicated |
TAF |
TDF |
|
Demographics | ||
|
Median age, years |
33 |
35 |
|
Female |
15 |
15 |
|
Race and ethnicity |
|
|
|
Black or African heritage |
26 |
25 |
|
Asian |
11 |
10 |
|
Hispanic or Latino |
19 |
19 |
|
HIV Disease Characteristics | ||
|
Median CD4 count, cells/?L |
404 |
406 |
|
CD4 <50 cells/?L |
3 |
3 |
|
HIV-1 RNA >100,000 c/mL |
23 |
22 |
|
Medical History | ||
|
Diabetes mellitus |
3 |
5 |
|
Hypertension |
14 |
17 |
|
Cardiovascular disease |
1 |
2 |
|
Hyperlipidemia |
14 |
13 |
|
Median estimated GFR, mL/min (Cockcroft-Gault) |
117 |
114 |
|
Median BMI (kg/m2) |
24 |
25 |
Method
- A randomized, double-blind study
- 1733 treatment na?ve adults were randomized 1:1 to once-daily TAF 10 mg (n=866) vs TDF 300 mg (n=867)
- Both were co-formulated with elvitegravir 150 mg, cobicistat 150 mg, and emtricitabine 200 mg (E/C/F)
- Efficacy was assessed by examining the proportion in each group with plasma HIV-1 RNA <50 copies/mL at week 144
Results
Efficacy Outcomes at week 144
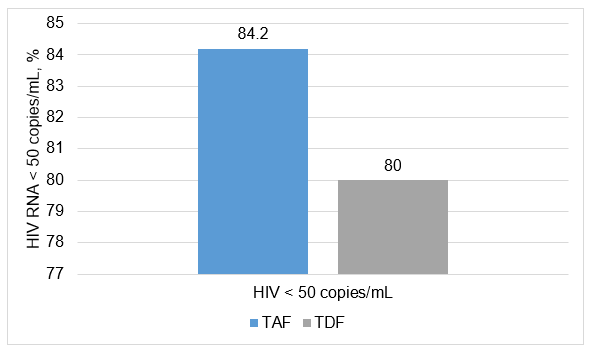
- TAF was superior to TDF in virologic efficacy, with 84.2% vs 80.0% having HIV-1 RNA, 50 copies/mL (difference 4.2%)
- At week 144
- CD4 cell counts increased in both groups, with a mean (SD) changes from baseline
- TAF= 326 (215.3) cells/mL, (P = 0.062)
- TDF =305 (204.5) cells/mL, (P = 0.062)
- Virologic failure with resistance occurred in 24 participants
- TAF=12 (1.4%) vs 12 (1.4%) on TDF by 144 weeks
- CD4 cell counts increased in both groups, with a mean (SD) changes from baseline
Safety at week 144
Drug-Related ADRS
- Both regimens continued to be well tolerated through week 144 with similar rates of drug-related AEs
- TAF (44.1%) vs TDF (48.9%).
- The most common drug-related AEs in both groups
- Nausea (TAF 10.5%, TDF 13.3%)
- Diarrhea (TAF 7.3%, TDF 8.9%)
- Headache (TAF 6.1%, TDF 5.4%).
- AEs leading to study drug discontinuation occurred in;
- 11 patients (1.3%) on TAF vs 29 (3.3%) on TDF
Bone Safety
- TAF had less impact than TDF on bone mineral density and renal biomarkers.
- Significantly smaller declines in total hip and lumbar spine BMD were reported with TAF than those receiving TDF through week 144
- % change from baseline at week 144: hip: TAF -0.75%, TDF -3.36%; spine: TAF -0.92%, TDF -2.95%) (P< 0.001)
- No discontinuations due to BMD decreases occurred with TAF
- Recovery from osteopenia or osteoporosis at either the hip or spine were reported in more patients on TAF (P <0.001)
- Hip: (TAF n = 14 vs TDF n = 10)
- Spine (TAF n = 24 vs TDF n = 10)
- TAF 47.3%, TDF 71.8%; (P <0.001)
- TAF=16.2% vs TADF=20.7%, (P = 0.018).
- Median percent changes in serum parathyroid hormone (PTH) from baseline were lower with TAF than TDF
- Calcium, vitamin D, or other nutritional supplements were initiated in fewer participants on TAF compared with TDF
Renal Safety at week 144
- No participants on TAF had renal-related discontinuations vs 12 on TDF (P< 0.001), with no cases of proximal tubulopathy for TAF vs 4 for TDF.
- Significantly lower median change from baseline in creatinine clearance (CrCl; eGFR by Cockcroft Gault) was reported with TAF (-1.6 mL/min) than TDF (–7.7 mL/min) (P< 0.001).
- Significantly fewer patients on TAF (17.6%) had a clinically meaningful decrease of >25% from baseline in CrCl compared with TDF (33.4%) (P< 0.001).
- Clinically significant proteinuria (urine protein to creatinine ratio200 mg/g) was reported in fewer participants on TAF
- TAF= 22 vs TDF=40, P = 0.016 for difference in distribution of changes above and below 200 mg/g
Effects on Lipids
- No difference in the total cholesterol to high-density lipoprotein ratio was observed
- Increases in total cholesterol (TC), high-density lipoprotein (HDL), low-density lipoprotein, and triglycerides were greater in the TAF group compared with the TDF group (P< 0.001)
- There were no differences between TAF and TDF in
- Cardiovascular or cerebrovascular events: 24 participants (2.8%) vs 33 (3.8%) (P = 0.28),
- Serious cardiovascular or cerebrovascular events: 5 (0.6%) vs 6 (0.7%) (P = 1.00)
- Use of lipid-modifying agents: 48 (5.5%) vs 50 (5.8%) (P = 0.92).
Conclusion
- In treatment na?ve HIV-1 patients, 3 years of treatment TAF-based single tablet regimen maintained a high rate of virologic suppression and met prespecified criteria for both noninferiority and superiority to a TDF-based similar combination.
- TAF was superior to TDF in virologic efficacy and produced significantly more favourable changes in multiple markers of renal and bone health.
- The study findings support the use of E/C/F/TAF as a safe, well-tolerated, and durable regimen for initial and ongoing HIV-1 treatment.
J Acquir Immune Defic Syndr 2017; 75:211–218