

Can Teriparatide Maintain the Higher Body Heights and Prevent Refracture in Osteoporotic Vertebral Compression Fracture Patient After Vertebroplasty?


Introduction
Refracture of cemented vertebrae occurs commonly after vertebroplasty (VP) in osteoporotic vertebral compression fracture (OVCF). Teriparatide (TP) is the recombinant human parathyroid hormone (1–34) that increases bone mass and decreases the risk of new vertebral fracture in patients with osteoporosis.
Aim
To assess whether TP can reduce refracture risk in OVCF patients after VP by comparing the radiological and clinical outcomes of cemented vertebrae with TP with those without TP.
Patient Profile
- Patients who underwent VP for OVCF with at least 1year follow-up
Methods
- Retrospective case-matched study
- 239 fracture in 166 patients
Study Design
Figure 1 Study design
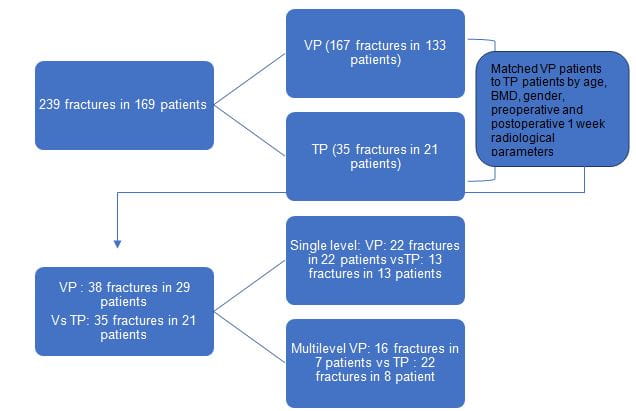
BMD: bone marrow density, OVCF: osteoporotic vertebral compression fracture, TP: teriparatide, VP: vertebroplasty
Intervention
- TP was started in teriparatide group during the duration 1 month before VP to 6 weeks after VP and used continually for at least 3 months
- TP was subcutaneously administrated daily based on the recommended protocol 20 microgram daily
Outcomes Measures
Radiological Outcomes
- The anterior body height (ABH) and middle body height (MBH) and kyphotic angle (KA) were measured before VP and 1 week and at least 1 year after VP
- Refracture was defined as a 15% decrease in ABH or MBH and 8° decrease in KA postoperative 1 year compared with those at postoperative 1 week
Clinical Outcomes
- Patient-reported outcomes of the case-matched VP and TP groups were evaluated pre-operatively and more than 1 year postoperatively.
- The preoperative visual analogue scale (VAS) and Oswestry disability index (ODI; Chinese version) were recorded by reviewing charts, and the postoperative outcomes were obtained through phone interviews.
Results
Comparison of TP and VP group
- No diferences in age, gender, fracture level, BMI, BMD, ODI, preoperative and postoperative-1-week radiological parameters were observed between the TP and VP groups, but preoperative pain VAS was reported more intense in TP group
Radiological Outcomes
- One year after VP, ABH and MBH were significantly greater, except KA, in the TP group
- Decrease in KA was more efficient in the TP group than in the VP group (VP group vs. TP group: −5.59° ± 7.31° vs. −2.14° ± 4.16°, p = 0.008)
- Postop-1y ABH and Postop-1y MBH was significantly higher in the TP group than in the VP group
- MBH maintenance rate (MR) and ABHMR was significantly more efficient in the TP group
|
|
VP |
TP |
P-Value |
|
n |
29 |
21 |
|
|
Fractures |
38 |
35 |
|
|
Multilevel |
7 |
8 |
|
|
Segment |
|
|
|
|
1 |
22 |
13 |
|
|
2 |
6 |
4 |
|
|
3
|
0 |
3 |
|
|
4 |
1 |
0 |
|
|
5 |
0 |
1 |
|
|
Age |
78.72 ± 7.42 |
79.19 ± 7.08 |
0.789 |
|
Gender |
|
|
|
|
F |
23
|
17 |
>0.9999 |
|
M |
6 |
4 |
|
|
BMI |
|
|
|
|
|
22.96 ± 3.42 |
23.14 ± 4.46 |
0.878 |
|
BMD |
|
|
|
|
|
−2.52 ± 1 |
−2.68 ± 0.98 |
0.565 |
|
ODI |
|
|
|
|
Preop |
65.73 ± 8.81 |
71.47 ± 9.67 |
0.101 |
|
Postop-1y |
21.13 ± 18.5 |
33.87 ± 16.24 |
0.079 |
|
VAS |
|
|
|
|
Preop |
7.5 ± 1.83 |
8.57 ± 1.88 |
0.048 |
|
Postop-1y |
2.69 ± 2.36 |
2.33 ± 2.35 |
0.722 |
|
Pain VAS improvement |
4.27 ± 3.01 |
6.23 ± 2.99 |
0.084 |
|
KA |
|
|
|
|
Preop |
−3.18 ± 10.65 |
−4.77 ± 12.74 |
0.572 |
|
Postop-1w |
0.56 ± 10.42 |
−0.71 ± 11.9 |
0.891 |
|
Postop-1y |
−4.97 ± 12.05 |
−2.85 ± 12.21 |
0.462 |
|
Decrease in KA |
|
|
|
|
Postop-1y |
−5.59 ± 7.31 |
−2.14 ± 4.16 |
0.008 |
|
ABH |
|
|
|
|
Preop
|
1.58 ± 0.61 |
1.75 ± 0.62 |
0.249 |
|
Postop-1w
|
1.98 ± 0.53 |
2.06 ± 0.55 |
0.289 |
|
Postop-1y |
1.56 ± 0.48 |
1.84 ± 0.56 |
0.027 |
|
ABHMR |
|
|
|
|
Postop-1y |
0.79 ± 0.11 |
0.89 ± 0.09 |
<0.0001 |
|
MBH |
|
|
|
|
Preop |
1.61 ± 0.55 |
1.63 ± 0.49 |
0.88 |
|
Postop-1w |
1.88 ± 0.48 |
1.94 ± 0.43 |
0.574 |
|
Postop-1y |
1.49 ± 0.39 |
1.73 ± 0.41 |
0.017 |
|
MBHMR
|
|
|
|
|
Postop-1y |
0.8 ± 0.09 |
0.89 ± 0.09 |
<0.0001 |
ABH: anterior body height; BMD: bone marrow density; BMI: body mass index; KA: kyphotic angle; MBH: middle body height; MR: maintenance ratio; ODI: Oswestry disability index; Preop: preoperative; Postop: postoperative; TP: teriparatide; VP: vertebroplasty
- After 1 year of VP, the refracture rates of KA, ABH, and MBH were significantly lower in the TP group compared with the VP group (figure 1)
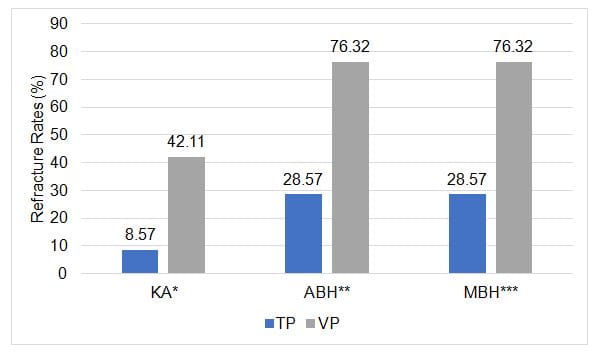
*p < 0.001, **p < 0.0001 ***p < 0.0001
Clinical Outcomes
- Preoperative pain VAS and ODI were significantly improved in both the TP and VP groups
- Postop-1y pain VAS and its improvement and ODI showed no significance between the two groups
Subgroup Analysis: Single-level VP group vs. TP group
Radiological Outcomes
- No difference in postop-1y KA and decrease in KA was observed in either group
- Postop-1y ABH and Postop-1y MBH was significantly higher in the TP group than in the VP group
- Single-level VP group vs. TP group: 1.52 ± 0.42 cm vs. 1.95 ± 0.5 cm, p = 0.011
- Single-level VP group vs. TP group: MBH 1.48 ± 0.35 cm vs. 1.8 ± 0.38 cm, p = 0.019).
- ABHMR and MBHMR was significantly more efficient in the TP group
- Single-level VP group vs. TP group: 0.79 ± 0.09 vs. 0.89 ± 0.09, p = 0.011
- Single-level VP group vs. TP group: 0.81 ± 0.07 vs. 0.89 ± 0.06, p = 0.003
Clinical Outcomes
- Pain VAS improvement in the TP group was significantly greater
- Single-level VP group vs. TP group: 4.27 ± 2.72 vs. 7.22 ± 2.77, p = 0.028)
- No significant difference was observed between the two groups in terms of postop-1y pain VAS and ODI
Multilevel Analysis
Radiological Outcomes
- No difference in postop-1y KA and Decrease in KA was observed in either group
- VP group vs. TP group: postop-1y KA −2.82° ± 12.9° vs. −1.98° ± 12.44°, p = 0.927; DKA − 5.94° ± 8.84° vs. −1.98° ± 3.71°, p = 0.071).
- Postop-1y ABH and Postop-1y MBH was not different between two groups
- Multilevel VP group vs. TP group: 1.58 ± 0.54 cm vs. 1.78 ± 0.59 cm, p = 0.324).
- Multilevel VP group vs. TP group: MBH 1.48 ± 0.42 cm vs. 1.69 ± 0.43 cm, p = 0.171).
- ABHMR and MBHMR was significantly more efficient in the TP group
- Multilevel VP group vs. TP group: 0.77 ± 0.14 vs. 0.89 ± 0.09, p = 0.005)
- Multilevel VP group vs. TP group: 0.79 ± 0.12 vs. 0.89 ± 0.11, p = 0.015)
|
Single level |
VP |
TP |
P |
|
Postop-1y KA |
− 7.71° ± 10.7° |
−2.18° ± 12.3° |
0.18 |
|
Decrease in KA |
− 5.42° ± 6.49° |
−2.42° ± 5.05° |
0.175 |
|
Postop-1y ABH |
1.52 ± 0.42 cm |
1.95 ± 0.5 cm |
0.011 |
|
ABHMR |
0.79 ± 0.09 |
0.89 ± 0.09 |
0.011 |
|
Postop-1y MBH |
1.48 ± 0.35 cm |
1.8 ± 0.38 cm |
0.019 |
|
MBHMR |
0.81 ± 0.07 |
0.89 ± 0.06 |
0.003 |
|
Multilevel Radiological Outcomes |
VP |
TP |
p |
|
|
|
| |
|
postop-1y KA |
2.82° ± 12.9° |
−1.98° ± 12.44° |
0.927 |
|
Decrease in KA |
− 5.94° ± 8.84° |
.−1.98° ± 3.71° |
0.071 |
|
Postop-1y ABH |
1.58 ± 0.54 cm |
1.78 ± 0.59 cm |
p = 0.324 |
|
ABHMR |
0.77 ± 0.14 |
0.89 ± 0.09 |
0.005 |
|
Postop-1y MBH |
1.48 ± 0.42 cm |
1.69 ± 0.43 cm |
0.171 |
|
MBHMR |
0.79 ± 0.12 |
0.89 ± 0.11 |
0.015 |
Clinical Outcomes
- Postop-1y pain VAS and ODI in TP group was significant greater
- Multilevel VP group vs. TP group: VAS 2 ± 2 vs. 4.17 ± 2.04, p = 0.048; ODI 20.8 ± 17.2 vs. 39.33 ± 9.09, p = 0.048
Conclusion
- TP was associated with higher BHs and fewer refractures than VP alone, with comparable clinical outcomes 1 year after VP
- TP may be associated with better improvement of pain VAS in those with single-level VP procedure.
- Higher BH was due to the better maintenance effect of TP
Reference
Sci Rep. 2020;10(1):6005