Introduction
Assessment of visual field (VF) progression is one of the most challenging tasks in glaucoma management. Better understanding on clinical risk factors associated with worsening of glaucoma may help in developing novel strategies for improving glaucoma care. Role of intraocular pressure (IOP) reduction in preventing VF deterioration has already been established, yet; many patients have continued to progress despite normalization of their IOP.
Aim
- To identify clinically relevant risk factors for progressive VF loss in patients with primary open-angle glaucoma (POAG)
- To compare the magnitude of treatment effect (in terms of progression rates) of dorzolamide 2% or brinzolamide 1%, each added to timolol 0.5%
Patient Profile
- Patients with POAG who had been previously treated with beta-blocker monotherapy for at least 6 months (age ≥40 years, n=161)
- All patients had mean diurnal IOP at baseline ≥20 mmHg and early VF defects
Methods
Study Design
- A randomized, evaluator-masked, parallel group study
Treatment Strategy
- Study subjects underwent a 4-week run-in period with timolol maleate 0.5% (1 drop in each eye b.i.d)
- Patients were then randomized to receive dorzolamide 2% or brinzolamide 1%, each added to timolol maleate 0.5%, b.i.d
Assessments
- A standard ophthalmic examination comprising of medical history, best corrected visual acuity (BCVA), slit-lamp examination of the anterior segment with dilated pupils, IOP measurement, gonioscopy, dilated funduscopic examination, stereoscopic optic disc photography, and automated perimetry
- Systolic blood pressure (SBP) and diastolic blood pressure (DBP) were measured and mean arterial blood pressure (MAP) was calculated. Ocular perfusion pressure was calculated using data on MAP and IOP
- Central corneal thickness was measured in 61 patients in the dorzolamide-timolol (DT) group and 64 patients in the brinzolamide-timolol (BT) group
- Factors associated with VF progression were estimated using a conditional Cox hazard model with patient intra-class correlation and were expressed as hazard ratios (HRs) with 95% confidence intervals (95% CIs).
Follow-up Period
- 60 months, with follow-up visits scheduled every six months
Results
- A total of 146 of the 161 patients made at least one valid visit at month 12 (DT group; n=70, BT group; n=76). The median follow-up period was 5.0 years and the mean follow-up period was 4.6 years.
- There was no significant change in systemic blood pressure during the treatment in any group. Ocular perfusion pressure increased significantly from 36.3 mmHg to 40.6 mmHg (p < 0.0001) in the DT group, and from 35.9 mmHg to 40.8 mmHg (p < 0.0001) in the BT group.
- The IOP did not differ significantly in both the study groups at baseline. The reduction in IOP did not differ significantly in both the groups at the end of the study period (Table 1).
|
Study group |
IOP Reduction at 5 years (p value) |
% patients achieving IOP reduction of <18 mmHg at end of the study |
|
DT Group |
20.3% (p<0.0001) |
42% |
|
BT Group |
21% (p<0.0001). |
47% |
- The end diastolic velocity (EDV) improved significantly in the ophthalmic artery (OA), central retinal artery (CRA) and short posterior ciliary artery (SPCA) from baseline to end of the study in the DT group but not in the BT group (Table 2). DT treatment was also associated with significant reduction in resistivity index (RI) in all retrobulbar vessels, but the same was not true for BT treatment.
|
EDV in various retrobulbar vessels |
DT Group |
BT Group | ||
|
Baseline |
End of the study |
Baseline |
End of the study | |
|
OA |
8.8 cm⁄s |
10.3 cm⁄s* |
9.0 cm⁄s |
8.9 cm⁄s |
|
CRA |
4.2 cm⁄s |
4.8 cm⁄s* |
4.2 cm⁄s |
4.3 cm⁄s |
|
SPCA |
4.5 cm⁄s |
5.3 cm⁄s* |
4.6 cm⁄s |
4.5 cm⁄s |
*p <0.0001
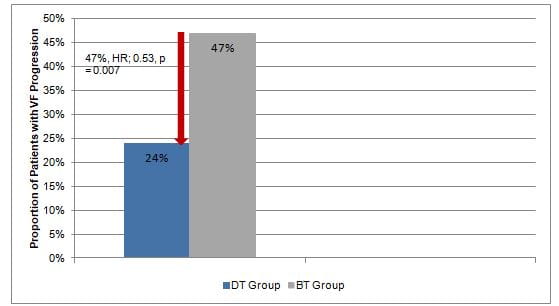
- Fewer patients treated with DT vs. BT had VF progression (24% vs. 47%, p=0.0006). The median time to VF progression was greater in DT vs. BT group (42 months vs. 30 months; p=0.003). DT treatment was associated with 47% lower risk of progression as compared with BT treatment (Fig 1).
- Lower DBP, lower MAP, anti-hypertensive treatment, lower EDV in the OA and SPCA, and a higher RI in the OA and SPCA at baseline predicted VF progression.
- Each centimetre per second increase of EDV in the OA and SPCA from baseline to the last follow-up visit, was associated with 30% and 20% decrease in progression risk, respectively. Each RI decrease (or increase) of 0.01 unit in the OA or SPCA was associated with an approximate 20% decrease (or increase) in risk for progression.
- As per the multivariate analysis, patients treated with DT rather than BT had a 35% lower risk of progression (HR = 0.65, 95% CI 0.41–0.90).
Conclusions
- Amongst patients with POAG, lower DBP, lower MAP, use of anti-hypertensive medication, lower EDV in the OA and SPCA, and higher RI in the OA and SPCA, were associated with increased progression of VF.
- Addition of dorzolamide rather than brinzolamide to timolol significantly reduced the risk of progression in patients with POAG.
Acta Ophthalmol. 2010: 88: 541–552.